|
3rd Quarter 2004 |
What a difference one year makes
|
||||
|
|
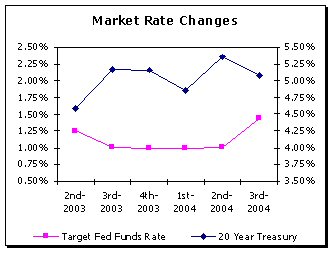 Earlier this year the Federal Reserve began raising the target fed funds
rate up from historic lows. On June 30, 2004 the target rate moved from
1.00% to 1.25% and by the end of September 2004 it was up to 1.75%. Since
then the Fed tightened again and the target rate now rests at 2.25% Earlier this year the Federal Reserve began raising the target fed funds
rate up from historic lows. On June 30, 2004 the target rate moved from
1.00% to 1.25% and by the end of September 2004 it was up to 1.75%. Since
then the Fed tightened again and the target rate now rests at 2.25%
In contrast, over that same time period there hasn’t been much increase in long-term treasury yield-curve rates. The 20-year treasury averaged 5.17% in 3rd quarter 2003 and quickly sank to another historic low in the 1st quarter of 2004 to 4.87%. Since then, the 20-year treasury has made a slight recovery reaching an average of 5.07% for 3rd quarter 2004. With short-term rates rising and the yield-curve flattening once again, industry analysts are concerned that interest margins will continue to be squeezed. How will banks handle this new rate environment? In the peer data for September 2004 there are two indicators that many banks may be at risk to rising rates. Trends in earnings at risk and growth/mix measures support the view that many banks will continue to experience pressure on their net interest margin.
As of September 30, 2003 the average net interest earnings at risk for small banks was -6.14%, for large banks the average was -11.37%. One year later as of September 30, 2004 the average was up slightly for small banks to -6.84%. For large banks the average dropped to -10.74%. Since the time the Fed last lowered rates in June 2003 to the end of September 2004 smaller banks have become more exposed to rising rates yet larger banks have become less exposed. The second noticeable peer data trend helps explain why. Growth and balance sheet mix It appears that both small and large institutions are riding the economic recovery wave. Both have experienced substantial loan growth over the past four quarters. However their funding choices appear to be quite different. As of September 2003 the average annual loan growth for small banks was 5.48% and the average for large banks was 12.27%. By September 2004 both groups had experienced an increase in growth with small banks growing loans by 8.26% annually, and large banks by 18.50%. While both segments have experienced higher loan growth, it appears each has chosen a different method of funding their loan growth. The peer data for September 2003 shows small bank deposit growth at 6.65% and large bank deposit growth 11.22%. One year later small bank deposit growth has slowed to 4.33%, while large bank deposit growth has increased to 14.35%.
Where has the additional funding come from? To make up the deposit short-fall, it appears that large banks utilized a traditional source of funding by liquidating some of their securities portfolio. For large banks total securities as a percentage of assets shrank from 27.0% in September of 2003 to 24.5% by September 2004. In contrast, small banks chose a less traditional route and increased short-term borrowings. Short-term borrowings as a percentage of assets grew for small banks from 1.4% to 2.2% while leaving their mix of securities essentially unchanged. Small banks’ increased dependence on borrowed funds is also reflected in the peer data’s liquidity measurements. Short-term non-core funding dependence moved from 0.37% in September 2003 up to 3.00% by September 2004. Rates are moving up for the foreseeable future. A bank that relies heavily on short-term funding is likely to have greater exposure to rising rates, because they are more sensitive to the Fed’s changes. As the Fed continues to tighten, the yield curve is likely to flatten even more, thereby squeezing net interest margin. One year ago what was your bank’s net interest earnings at risk? Is it increasing? Are your experiencing healthy loan growth? Are your deposits growing at the same pace? If not, where will your additional funding come from? Do you know how your funding decisions impact your ability meet your net interest margin goals as interest rates rise? |
|
This
A/L BENCHMARKS Industry Report article was published |
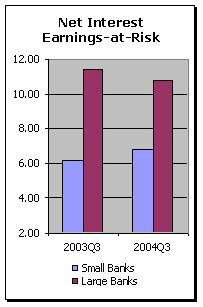 Changes in net interest earnings at risk
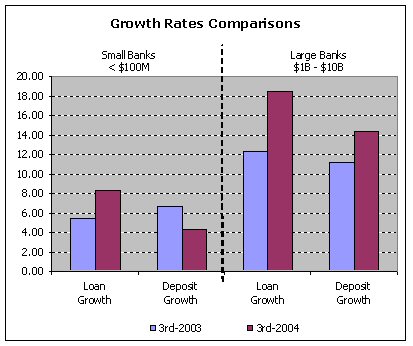 In either case there was still a shortfall. Both small and large banks
needed more than just deposits to fund their strong loan growth. Funding was
clearly a problem for smaller banks since their deposit growth rate actually
slowed.
In either case there was still a shortfall. Both small and large banks
needed more than just deposits to fund their strong loan growth. Funding was
clearly a problem for smaller banks since their deposit growth rate actually
slowed.