|
4th Quarter 2003 |
Core Deposit Pricing and Interest Rate Risk
|
||||
|
|
 These days the question is not “Will interest rates rise?” but rather “When
will interest rates rise?” The current historically low interest rate
environment has certainly been with us longer than many had anticipated.
And, given the looming general election in November, many feel the rate
environment isn’t likely to change in the immediate future. These days the question is not “Will interest rates rise?” but rather “When
will interest rates rise?” The current historically low interest rate
environment has certainly been with us longer than many had anticipated.
And, given the looming general election in November, many feel the rate
environment isn’t likely to change in the immediate future.
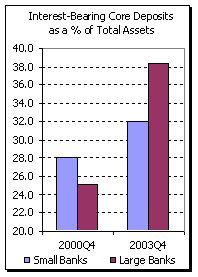
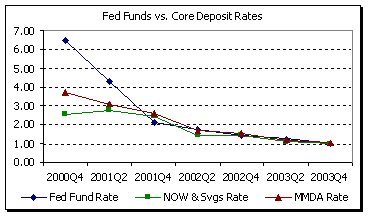
During this low rate environment there has been significant growth in interest-bearing transaction deposits (NOW, Other Savings, and Money Market Deposit Accounts). In December 2000 small banks had 28.0% of their assets funded by interest-bearing transaction deposits. By December 2003 the percentage had increased to 31%. For larger banks the increase was much more significant, rising from 25% in December of 2000 to almost 39% by December 2003. Over the same time frame the Fed dropped its target Fed Funds rate by 550 basis points. In December 2000 Fed Funds was at 6.50% and by December 2003 it was down to 1.00%. Following the Feds lead, bankers have dropped their Now, Savings, and Money Market Rates. The average rate paid on NOW & Savings accounts was 2.56% in December 2000. By December 2003 the rate had dropped to just below 1.00%. Money market rates have decreased also moving from 3.74% in December 2000 down to 1.05% by the end of last year.
This squeeze on net interest margin has many bankers looking forward to rising rates. The common perspective is that as the Fed raises its target rate, banks will be able to keep their interest-bearing core deposit rates low thereby relieving the pressure on margin. In the face of rising rates, the longer banks can maintain their low cost on core deposits the better. But how easy will it be for banks to contain their core deposit costs? Certainly it will depend on the nature of the customers and the types of accounts offered. Are customers rate sensitive and/or are the accounts indexed? It may also depend on the level of service a bank provides. Regardless of the reason it is important that bankers determine their pricing strategy in response to rising rates. Will they have to increase their interest-bearing core deposit expense by a little or a lot? Why or why not? Once bankers have a better understanding of their core deposit behavior, it is important that they examine their interest rate risk model to verify that the modeling assumptions reflect the anticipated behavior. Using good assumptions in an interest rate risk model is crucial to receiving reliable results. Given a bank’s strategy for interest-bearing core deposit pricing, what will the overall impact be on net interest margin? Do the modeling assumptions match the strategy? Depending on what assumptions are used, a model could predict very different results for banks that seem to have similar profiles. To illustrate the dramatic impact different modeling assumptions have on a bank’s interest rate risk here are the profiles of three sample banks. All three banks are similar in size at around $75 million in total assets. All three have similar earning assets and similar funding. As of December 2003 all three banks have the exact same level of interest-bearing core deposit expense and all have approximately the same net interest margin percentage at 4.46% Read each of the following profiles. In each profile note the differences between each bank and how those differences impact the bank’s modeling assumptions for core deposit pricing. Case Bank A For years the bank has relied on superior customer service and
convenience to attract and keep their customers. The bank has been paying
about 50 basis points on these accounts for years; even before the Fed’s
dramatic drop in rates. If rates were to rise +200bp, the bank knows it
would have to pay up on its indexed money market accounts, but they don’t
believe there would be any material increase in their NOW and Savings cost.
As a result, Bank A expects to gain 3.68% in total net interest income if
rates rise. Case Bank B The bank is well aware of the volume increases in its money market accounts over the past several years. Most likely this is money that customers have parked here, after shopping for the best rate, until the stock market appears more stable. If rates were to rise +200bp, the bank would have to increase the rate paid on their money market accounts and they would very likely leave the rate on their small number of NOW accounts alone. As a result, Bank B expects to lose -13.15% in total net interest income if rates rise. Case Bank C
Things are not always as they seem
This stark contrast in expected change to net interest income shows just how critical good modeling assumptions can be. It should prompt you to verify the assumptions that your model is using. What is your model telling you about your expected net interest income as rates begin to rise? Will your margin improve? Or will it decline? If a decline is anticipated, are your comfortable with the magnitude? Your core deposit pricing assumptions can have a major impact on your bank’s projected net interest income at risk. What is your core-deposit pricing strategy for a rising rate environment and do your modeling assumptions reflect this strategy? • Further Reading |
|
Copyright © 2005 Olson Research Associates, Inc. - All Rights Reserved |
 Since these administered and short-term rates can’t fall much further,
net interest margin is suffering. This problem has had more of an impact on
smaller banks where net interest margin is a more significant portion of
overall income. From December 2000 to December 2003 net interest margin for
banks under $100 million fell nearly 40 basis points from 4.69 down to 4.30.
Since these administered and short-term rates can’t fall much further,
net interest margin is suffering. This problem has had more of an impact on
smaller banks where net interest margin is a more significant portion of
overall income. From December 2000 to December 2003 net interest margin for
banks under $100 million fell nearly 40 basis points from 4.69 down to 4.30.
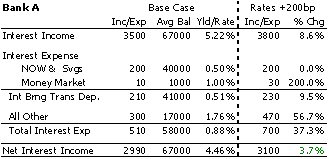 Bank A is a $75 million institution. As of year end they had $67 million
in earning assets which generated $3.5 million in interest income for a
yield of 5.22%. The bank relies heavily on $41 million in interest-bearing
core deposits to fund over 50% of their assets. Only $1 million of this core
funding is in the bank’s indexed money market account. The remaining $40
million is in the bank’s NOW and savings accounts.
Bank A is a $75 million institution. As of year end they had $67 million
in earning assets which generated $3.5 million in interest income for a
yield of 5.22%. The bank relies heavily on $41 million in interest-bearing
core deposits to fund over 50% of their assets. Only $1 million of this core
funding is in the bank’s indexed money market account. The remaining $40
million is in the bank’s NOW and savings accounts. 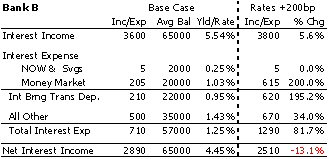 bank’s standard NOW account
product.
bank’s standard NOW account
product. 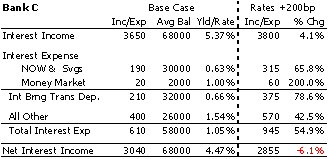 For years the bank has relied on superior customer service and
convenience to attract and keep their regular NOW account customers. The
“Gold Savings” program was just introduced 2 years ago to attract the money
fleeing from the stock market. The bank has been paying about 50 basis
points on its regular now accounts for years; even before the Fed’s dramatic
drop in rates, but it is aware that it must keep its “Gold Savings” rate
competitive with the market. If rates were to rise +200bp, the bank knows it
would have to pay up on its indexed money market accounts and its “Gold
Savings” accounts. They believe they would have to raise rates only slightly
on their regular NOW accounts. As a result, Bank C expects to lose -6.06% in
total net interest income if rates rise.
For years the bank has relied on superior customer service and
convenience to attract and keep their regular NOW account customers. The
“Gold Savings” program was just introduced 2 years ago to attract the money
fleeing from the stock market. The bank has been paying about 50 basis
points on its regular now accounts for years; even before the Fed’s dramatic
drop in rates, but it is aware that it must keep its “Gold Savings” rate
competitive with the market. If rates were to rise +200bp, the bank knows it
would have to pay up on its indexed money market accounts and its “Gold
Savings” accounts. They believe they would have to raise rates only slightly
on their regular NOW accounts. As a result, Bank C expects to lose -6.06% in
total net interest income if rates rise. 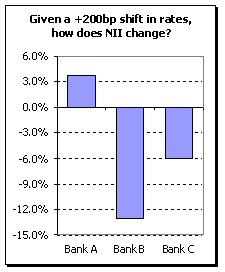 The biggest difference among the three is the approach to core-deposits
pricing given a +200bp rise in rates. Each unique approach creates a wide
variation in the modeling results. While Bank A expects to increase their
margin by 3.7%, Bank C expects to lose -6.1%. The expectation for Bank B is
even worse; they predict a loss of -13.1%.
The biggest difference among the three is the approach to core-deposits
pricing given a +200bp rise in rates. Each unique approach creates a wide
variation in the modeling results. While Bank A expects to increase their
margin by 3.7%, Bank C expects to lose -6.1%. The expectation for Bank B is
even worse; they predict a loss of -13.1%.